Where do I see my Shopify analytics, and what does each place show?
Shopify Analytics (the Analytics dashboard and Reports in your admin) shows sales, sessions, conversion and traffic sources; Live View shows the last few minutes as counts; Google Analytics 4 adds Google's own traffic reports. For a quick live overview of each shopper's cart, checkout and order, CartSpy is an app for Shopify built for that.
This page maps the common questions to the place that answers them, with the Shopify Help Center pages behind each fact.


| You want to know | Where to look |
|---|---|
| Sales, orders and sessions for a date range | Shopify: Analytics (the overview dashboard) |
| Sales by product, traffic by source, inventory | Shopify: Analytics > Reports (Sales, Acquisition, Inventory and other categories) |
| How many sessions add to cart, reach checkout and buy | Shopify: the Conversion rate breakdown report (Behavior) |
| How many people are on the store right now | Shopify: Analytics > Live View (visitors active in the past 5 minutes) |
| Traffic and events in Google's reports | Google Analytics 4, connected through the Google & YouTube sales channel |
| Which shopper has what in their cart, live, and where they came from | CartSpy: one card per cart, as it happens |
| Carts that were left before checkout, with their products | CartSpy: Abandoned Carts (Shopify lists abandoned checkouts, which begin at checkout) |
In your Shopify admin, Analytics opens a dashboard of key sales, sessions and fulfillment metrics across all your sales channels, for any date range, with a comparison to an earlier period. Its metric cards can be added, removed, rearranged and grouped into sections, and you can set targets for a metric.
Analytics > Reports lists Shopify's default reports in categories such as Acquisition, Inventory, Sales and Behavior. Each one can be adjusted from its default settings and exported. A report shows up to 1,000 rows on screen; totals still cover every row. Every category is explained in Shopify reports.
The Behavior reports include the Conversion rate breakdown: the share of sessions that added to cart, reached checkout and completed checkout. Session reports can be filtered by human and bot traffic.
Analytics > Live View shows a map or globe of recent visits and orders, and cards for visitors right now (active in the past 5 minutes), total sales, sessions and orders since midnight, top locations and top products. Its Customer behavior card counts the sessions of the last 10 minutes with active carts, checking out and purchased.
Those are counts. To see the carts behind them, one shopper at a time, see CartSpy vs Shopify Live View.
GA4 is connected through the Google & YouTube sales channel: you create a GA4 property and a web data stream in Google Analytics, then set up your Google tag from Shopify. Its numbers will not match Shopify's exactly, because the tools count differently; Shopify's Help Center notes that Google does not reveal how it determines a real-time visitor count. The setup step by step: Google Analytics and Shopify.
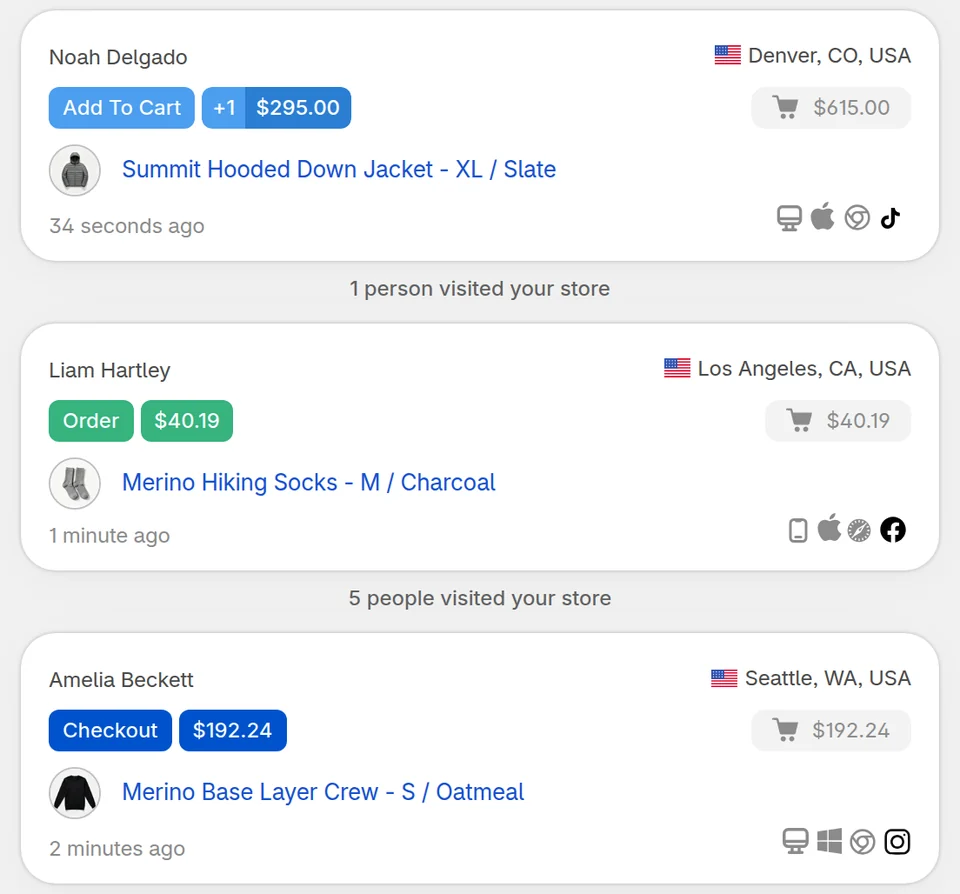
CartSpy (one word) is a live feed of every cart, checkout and order; it does not record sessions or make heatmaps. It sits next to Shopify Analytics: Shopify stays the source for what sold, and CartSpy shows what is happening in the carts right now, keeps every abandoned cart with its products, and sums up yesterday's carts in a short email each morning.
Related: what Shopify Analytics misses before checkout · traffic sources that buy · are my ads working?
In your Shopify admin, go to Analytics. The Analytics page is a dashboard of sales, sessions and fulfillment metrics, Analytics > Reports holds the report library, and Analytics > Live View shows the last few minutes. For a quick live overview of each shopper's cart, checkout and order, add CartSpy, an app for Shopify.
No. Shopify's Live View counts sessions with active carts, checking out and purchased over the last 10 minutes, and the reports show totals and rates. CartSpy shows each cart on its own: the products, the cart value, how far the shopper got and where they came from.
They count in different ways. Shopify's Help Center says Live View data might vary from analytics tools from other companies, and that Google does not reveal how it determines its real-time visitor count. Use Shopify for orders and sales, and treat the other tools as a second view.
Create a GA4 property and a web data stream in Google Analytics, then install the Google & YouTube sales channel in Shopify and follow Google's steps to set up your Google tag. Shopify's Help Center describes the steps.
Install, and every cart shows up as shoppers shop. 7-day free trial, cancel any time.
Start free trial