What reports does Shopify have, and where do I find them?
In your Shopify admin, go to Analytics > Reports. Shopify's default reports are grouped into categories such as Acquisition, Behavior, Customers, Inventory, Marketing, Profit and Sales, and reports can be adjusted from their default settings and exported. For a quick live overview of each shopper's cart, checkout and order, CartSpy is an app for Shopify built for that.
What each category shows, the limits worth knowing, and the Shopify Help Center pages behind each fact.


| Category | What it shows, with example reports |
|---|---|
| Acquisition | How visitors come to your store: Sessions by referrer, Sessions by location, Sessions over time, Visitors over time. Visits only, no sales. |
| Behavior | How shoppers use the store: Conversion rate breakdown (added to cart, reached checkout, completed checkout), Sessions by landing page, Sessions by device, Searches with no results. |
| Customers | Who buys: New vs returning customers, Customers by location, Customer cohort analysis, RFM customer analysis. |
| Inventory | Stock: Month-end inventory snapshot, Products by sell-through rate, ABC product analysis, Inventory remaining per product. |
| Marketing | What brings buyers: Performance by marketing channel, Performance by marketing campaign, Sales attributed to marketing, Conversion by attribution model. |
| Profit | Costs and margins: Gross profit by product, Gross profit by product variant, Profit margin by order. Needs a cost per item on your products. |
| Sales, Order, Finance, Fraud, Retail sales | Sales and orders over time, your finances, orders that might be fraudulent, and point of sale orders. |
Any report can be customized as a new data exploration, and a custom report also becomes a metric card for the Analytics dashboard. For more, the ShopifyQL query editor lets you write your own queries on your store's data. Shopify's Help Center says you can ask Sidekick for data such as sessions by referrer or conversion rate by device, and for help writing a ShopifyQL query.
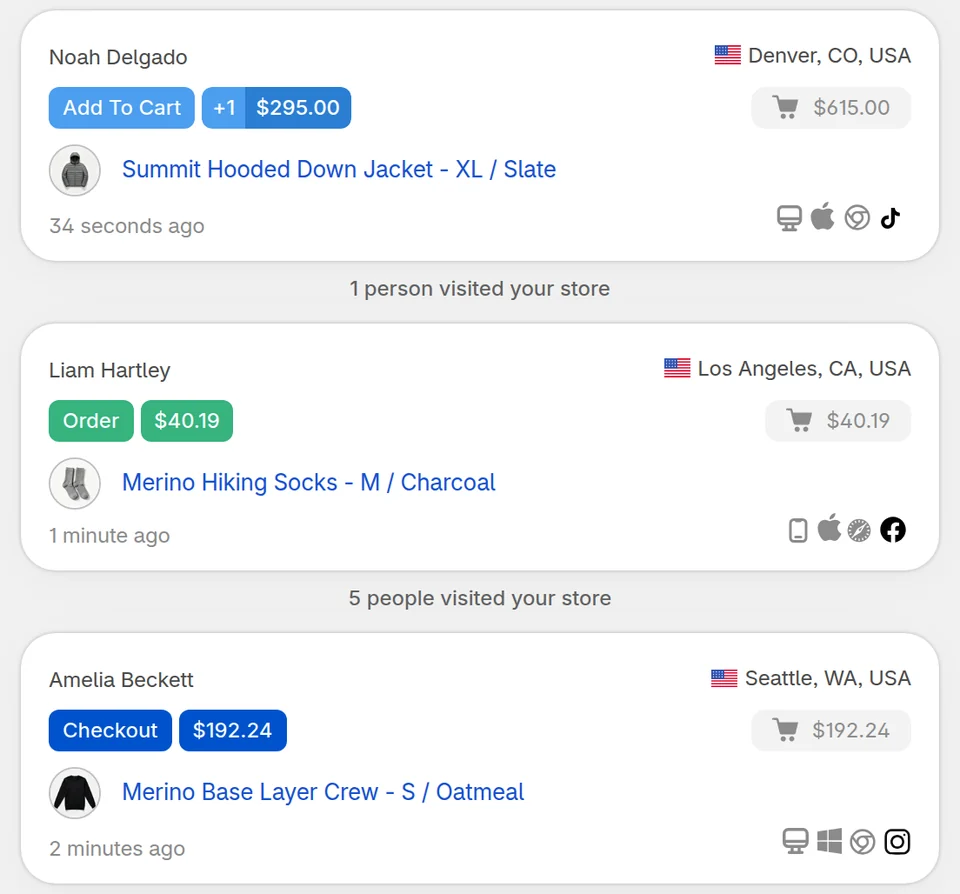
Shopify's reports add up sessions, rates and sales. CartSpy (one word) shows the carts behind those numbers, one shopper at a time and as it happens: the products, the cart value, how far the shopper got and where they came from. It keeps every abandoned cart with its products, including carts left before checkout, and sums up yesterday's carts in a short email each morning.
Related: Shopify analytics: what you can see where · what Shopify Analytics misses before checkout · a daily email report of your carts
In your Shopify admin, go to Analytics > Reports. In the Shopify app on your phone, tap Analytics > Reports. Use the Category filter to show only one kind of report, such as Sales or Behavior.
Shopify's default reports are grouped into Acquisition, Behavior, Customers, Finance, Fraud, Inventory, Marketing, Order, Profit, Retail sales and Sales. Reports can be adjusted from their default settings, and a customized report can be saved as a new data exploration.
Reports display a maximum of 1,000 rows so they load quickly. Totals still cover every row. To get all the rows of a large report, export it.
The Conversion rate breakdown report in the Behavior category shows the share of sessions that added to cart, reached checkout and completed checkout. To see each cart on its own, with the products and where the shopper came from, add CartSpy, an app for Shopify.
Yes. Any report can be customized as a new data exploration, and the ShopifyQL query editor lets you write your own queries. Shopify's Help Center says you can also ask Sidekick to help write a ShopifyQL query.
Install, and every cart shows up as shoppers shop. 7-day free trial, cancel any time.
Start free trial